Saving $23,640 by just optimizing queries

Before I started making changes to the infrastructure, the rule was simply to go one step up in server size. Every time there was a spike and it was confirmed that the database was the root cause, the server size was increased, and at some point we had a single 8xlarge instance for our main database.

In the past, there was no logging system implemented, and the actions were based only on resource usage. We started getting better insight after our Datadog implementation in AWS. We set alerts for resource usage, and we also enabled logs from the database, including the slow query logs.
At the beginning, we were checking logs on CloudWatch when an alert was raised, making it a bit slow to realize what was actually happening. I’m glad at some point I introduced Grafana as an alternative to get real-time reports so we could measure the health of our website. After a few days of the implementation, I discovered Grafana has a community that shares their dashboards, and by simply copying the IDs you can set the same dashboard.
I used this cool one for Cloudwatch logs
The dashboard lets you filter by the log groups, and by default I set it to show the slow query logs. With this I was able to quickly find the queries and also the origin of them, as this report gives you all the information related to the query: the user, host, execution time, and of course, the full query.

When a slow query is detected, the process is simple: find the portion of code that is executing it, try to optimize the query by either changing the structure or adding indexes. Sometimes it is also required to change the logic behind the query to improve it.
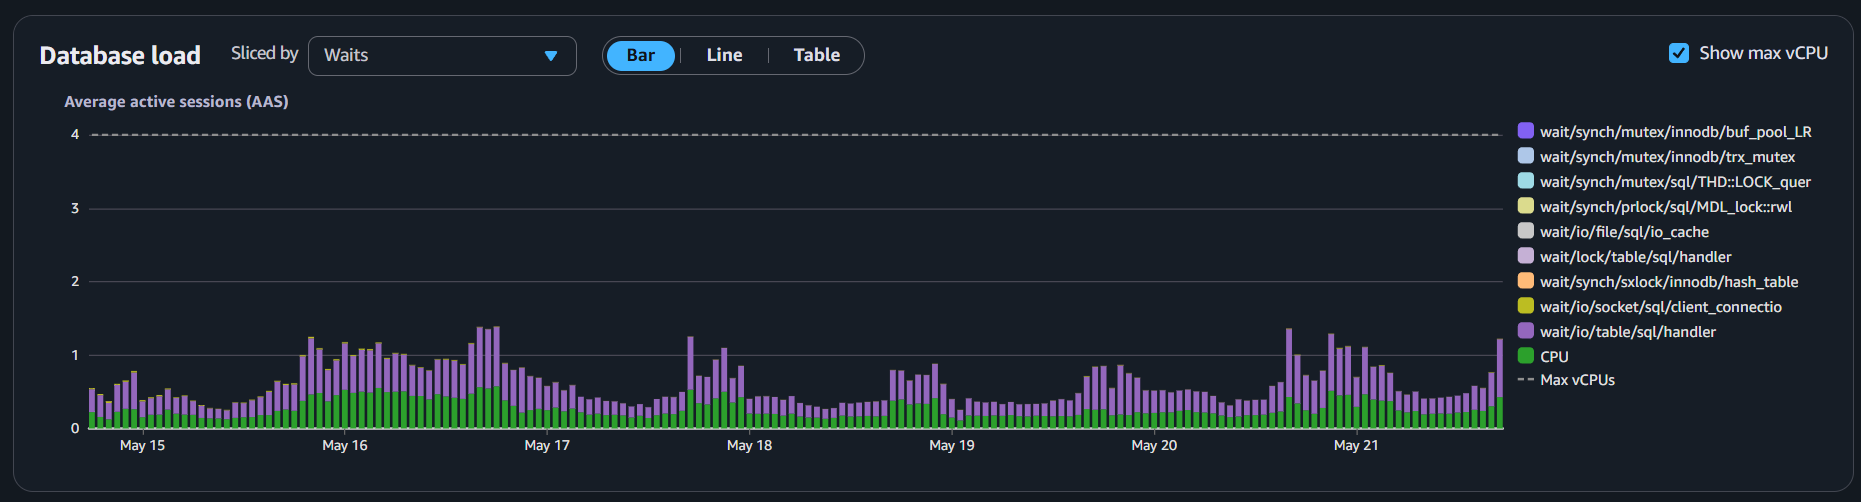
This is an everyday task. As soon as we detect a query that impacts the performance, we immediately attempt to fix it. As a consequence of this, our main database is a much smaller instance, and as you can see in the following graphic, most of the time it is under 10% of usage, allowing us to downsize it even more.
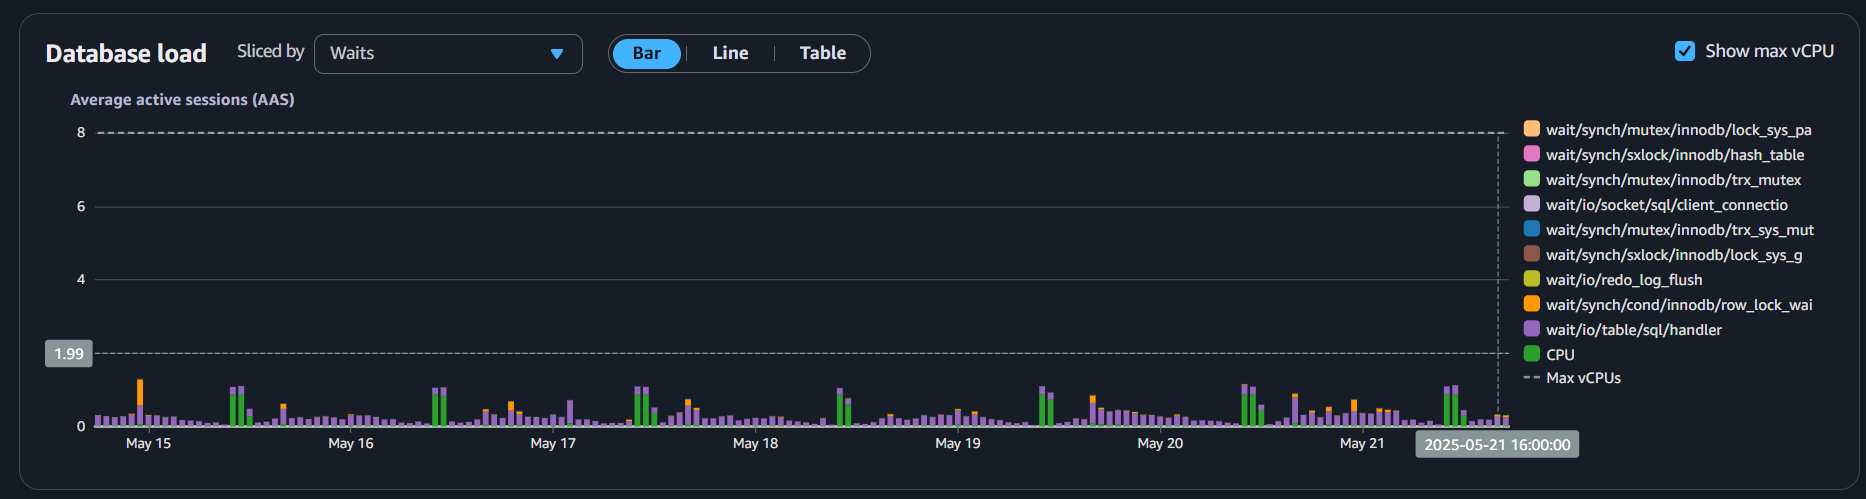
Also, we implemented read replicas that manage all the SELECT queries and reporting, offloading all that from the writer instance, and we can probably downsize it as well, as CPU usage is always under 25%.
By implementing these tools, measuring our database’s health is easier. Over time, we are able to improve speed, resiliency, and response time.
Get quality content updates subscribing to the newsletter, Zero Spam!